First attempt delivery rate (FADR) is the percentage of packages delivered successfully on the first try, calculated as successful first deliveries divided by total attempts.
It’s the most important last-mile metric because a single failed attempt drives up cost, delays the order, and erodes customer trust all at once — and it sits upstream of nearly every other delivery KPI. Most operators aim for a rate above 85%. The best ways to improve it are validating addresses at checkout, communicating proactively with customers, offering flexible delivery options, and optimizing routes.
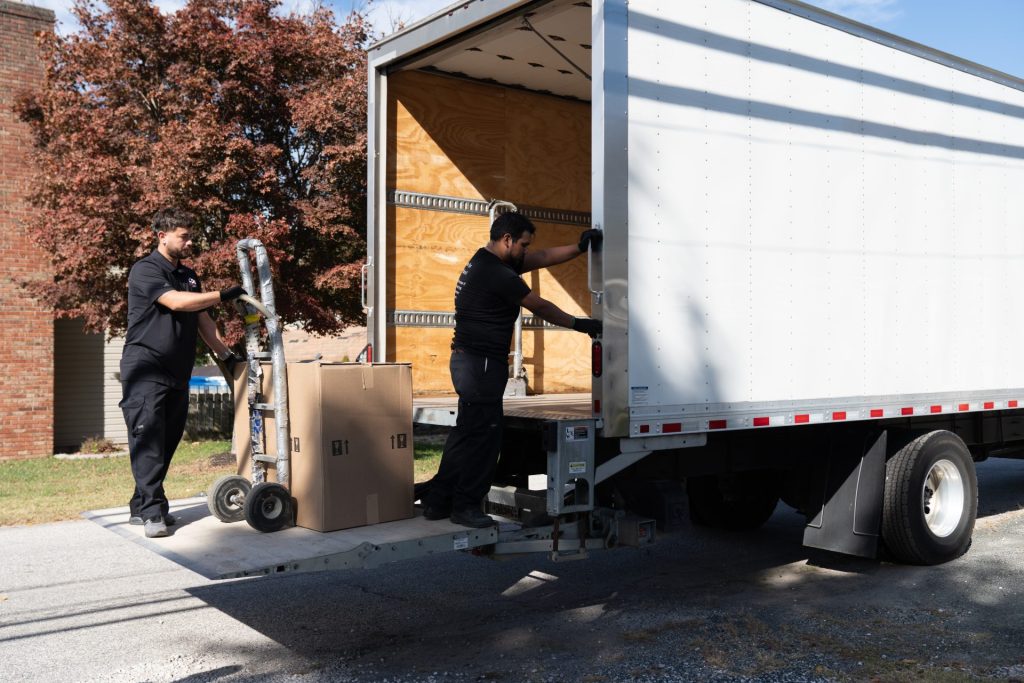
Picture the last hundred feet of a delivery. A driver pulls up to the curb, walks a package to the door, knocks—but then no one answers. In that single, quick moment, a sale that took marketing, merchandising, and fulfillment to earn quietly starts losing money. The parcel goes back on the truck, the route runs long, a support ticket is born, and somewhere a customer begins to wonder whether they’ll order from you again. That moment, repeated thousands of times a week across a fleet, is exactly what first attempt delivery rate measures.
First attempt delivery rate (FADR) is the percentage of packages delivered successfully on the very first attempt—no redelivery, rescheduling, or returns. You calculate it by dividing successful first deliveries by total delivery attempts and multiplying by 100. It sounds almost too simple to be important. It is, in fact, the single most revealing number in last mile delivery, because everything that can go wrong in that final stretch shows up here first.
What the Number Really Tells You
FADR is less a metric than a diagnosis. When a fleet completes 9,200 of 10,000 deliveries on the first try, the 92% that results is easy enough to read. But the more interesting story is in the missing 8%. Each of those failures is the visible end of an invisible chain: an address that was never verified, a delivery window no one was home for, a route that ignored when customers were actually available.
A high first attempt rate means routing, address data, customer communication, and timing are all quietly working together. A low one is an early warning that something upstream has broken—and that costs are already piling up, whether anyone is watching the dashboard or not.
That is why seasoned operators treat FADR as a leading indicator rather than a vanity stat. On-time rate, cost per delivery, and customer satisfaction all tend to move with it, because they are downstream of the same root causes. Fix the first attempt and the rest tend to follow.
Why a Single Missed Knock Is So Expensive
The trouble with a failed delivery is that you pay for it twice and then keep paying. Industry research puts the average direct cost of one failed package—the labor to re-attempt it, the customer-service time to field the complaint, the logistical disruption of slotting it back into a route—at roughly $17.78.
That figure feels small until it is multiplied by volume. A company shipping 140,000 orders a year with just a 5% failure rate is looking at close to $200,000 in losses, and an 8% first-time failure rate has been estimated to cost retailers nearly $197,730 annually. Step back to the level of the whole economy and the number becomes almost abstract: delivery failures are linked to an estimated $216 billion in lost retail revenue across the United States every year.
Since the last mile already swallows somewhere between half and sixty percent of total delivery costs, every inefficiency in this segment lands with unusual force.
And the financial hit is only the part you can put on a spreadsheet. The delivery is often the only physical, real-world moment a customer ever shares with a brand—the one touchpoint that isn’t a screen. A missed delivery doesn’t read as a logistics hiccup; it reads as a broken promise. The consequences follow accordingly: roughly 23% of consumers say they won’t reorder after a failed delivery, and about 21% lose trust in the retailer outright.
The mirror image is just as telling — 96% of customers who have a smooth delivery experience say they’re more likely to buy again. The first attempt, in other words, isn’t only an operations event. It’s a retention event wearing an operations costume.
What makes it genuinely dangerous is how rarely a single failure stays contained. One missed knock tends to set off a cascade. The package has to be re-run, burning fuel, driver hours, and truck capacity. A wave of “Where is my order?” inquiries hits the support queue.
Undelivered parcels accumulate at the depot and clog reverse-logistics workflows. And the deliveries that fail often enough eventually curdle into returns—the most expensive outcome of all. Because FADR sits upstream of every one of these problems, it offers rare leverage: improve it, and you are quietly improving half a dozen other metrics at the same time.
Why First Attempts Fail
You can’t lift the number without understanding what drags it down, and the culprits are remarkably consistent. The most common, by a wide margin, is the simplest: no one is home, especially when a signature is required. Close behind are addresses that were wrong or incomplete to begin with, whether it’s a missing unit number or a single digit that’s off.
Then come access problems: gated communities, locked lobbies, nowhere to leave a parcel safely or even park. Narrow or poorly chosen delivery windows compound, sending couriers to the door when the recipient can’t receive them, and routes that are sequenced for the depot’s convenience rather than the customer’s availability do the rest. The thread running through nearly all of these is worth noticing: they are failures of data and communication, not of effort. They are fixable before the truck ever leaves the yard.
How the Best Operators Lift the Number
The highest-leverage work happens upstream, long before a driver touches the package. It starts with address quality.
Proactive notifications—and SMS in particular, with open rates approaching 99% and delivery rates around 98%—dramatically raise the odds that someone is home or has at least left instructions. Paired with accurate, narrow ETA windows and live tracking, a simple text message turns out to be one of the cheapest, highest-impact tools in the entire last mile.
Underpinning all of it is route optimization, consistently cited as the highest-ROI technology investment in the last mile. By sequencing stops around real customer availability, traffic, and realistic timing, operators routinely see on-time delivery climb 12 to 18% and cost per delivery fall 20 to 30%, with first-attempt success rising right alongside.
Here at CDS Logistics, this manifests with our own in-house technology deck: the CDS Vision Suite™. Using our decades of experience in the last mile delivery space, we created the Vision Suite™ with operators in mind, offering last mile visibility, tracking, and scheduled messaging to go out to customers up until the moment products reach their doorstep.
The Bottom Line
First attempt delivery rate endures as the most important last-mile metric for a simple reason: it is the closest thing the final leg has to an honest health check. In one number it captures cost efficiency, operational reliability, and customer experience all at once, and because a single failed attempt ripples outward into redelivery costs, support tickets, returns, and lost loyalty, every percentage point you recover compounds in your favor. Get more packages delivered right the first time, and you don’t just improve one statistic. You improve the whole story the last mile tells about your business.
Frequently Asked Questions
What is first attempt delivery rate?
First attempt delivery rate (FADR) is the percentage of packages delivered successfully on the first delivery attempt, with no redelivery, reschedule, or return required. It’s a core measure of last-mile operational reliability.
How do you calculate first attempt delivery rate?
Divide the number of deliveries completed on the first attempt by the total number of delivery attempts, then multiply by 100. For example, 9,200 first-attempt successes out of 10,000 attempts equals a 92% FADR.
What is a good first attempt delivery rate?
An 80–85% rate is the industry baseline, 85–90%+ is strong, and 90%+ is best-in-class. Falling below 85% is a signal to investigate root causes such as address quality or delivery windows.
Why is first attempt delivery rate important?
A failed first delivery roughly doubles the cost of that delivery, generates support inquiries, and damages customer trust—about 23% of consumers won’t reorder after a failed delivery. Improving FADR lowers cost and protects revenue at the same time.
How can I improve my first attempt delivery rate?
Proactive SMS notifications, offer flexible time slots and safe-place instructions, and route optimization software that accounts for customer availability.
About CDS Logistics: Experts in Big and Bulky Last Mile Delivery
CDS Logistics is one of the largest providers of last mile delivery and fulfillment solutions in the United States. CDS’s headquarters is in Baltimore, Maryland, with 182 hubs nationwide. Over the past three decades, CDS has built expertise to make the company an industry leader specializing in big and bulky products. CDS’s proprietary, in-house technology and hands-on operational expertise provide results that are consistent, reliable, and proven to drive outstanding customer experiences.
Click the buttons below to learn more about the industries we serve, as well as the services we provide.
- How White-Glove Delivery Reduces Damage Claims on Heavy Fitness Equipment
- How Route Optimization Software Actually Cuts Delivery Costs
- In-Home Delivery vs. Threshold Delivery vs. Curbside: What’s the Difference?
- Jobsite Coordination: Why Builder Schedules Should Drive Your Delivery Windows
- How Window and Door Manufacturers Can Cut Damage Claims in Half

